M.G. Borda1,2,3, J. Patricio Baldera1,4, D. Patino-Hernandez2,5, E. Westman3,6, M.U. Pérez-Zepeda7,8, F.J. Tarazona-Santabalbina9,10,11, H. Wakabayashi12, H. Arai13, M. Kivipelto3,14,15, D. Aarsland1,16 in behalf of NJ FINGER
1. Centre for Age-Related Medicine (SESAM), Stavanger University Hospital. Stavanger, Norway; 2. Semillero de Neurociencias y Envejecimiento, Ageing Institute, Medical School, Pontificia Universidad Javeriana, Bogotá, Colombia; 3. Division of Clinical Geriatrics, Center for Alzheimer Research, Department of Neurobiology, Care Sciences and Society, Karolinska Institutet, Stockholm, Sweden; 4. Escuela de Estadística de la Universidad Autónoma de Santo Domingo, Santo Domingo, República Dominicana; 5. Internal Medicine Department. San Ignacio University Hospital. Bogotá, Colombia; 6. Department of Neuroimaging, Centre for Neuroimaging Sciences, Institute of Psychiatry, Psychology and Neuroscience, King’s College London, London, UK; 7. Instituto Nacional de Geriatría, Mexico DF, Mexico; 8. Centro de Investigación en Ciencias de la Salud (CICSA), FCS, Universidad Anáhuac México Campus Norte, Huixquilucan Edo. de México; 9. Geriatric Medicine Department, Hospital Universitario de la Ribera, Carretera de Corbera km. 1, 46600 Alzira, Spain; 10. Centro de Investigación Biomédica en Red Fragilidad y Envejecimiento Saludable (CIBERFES), 28029 Madrid, Spain; 11. Medical School, Universidad Católica de Valencia San Vicente Mártir, 46001 Valencia, Spain; 12. Department of Rehabilitation Medicine, Tokyo Women’s Medical University Hospital, Japan; 13. National Center for Geriatrics and Gerontology, Obu, Japan; 14. Institute of Public Health and Clinical Nutrition, University of Eastern Finland, Kuopio, Finland; 15. Department of Psychiatry, Cognition and Old Age Psychiatry, Sahlgrenska University Hospital, Mölndal, Sweden; 16. Department of Psychological Medicine, Institute of Psychiatry, Psychology, and Neuroscience, King’s College London, London, UK
Corresponding Author: Miguel German Borda, Helse Stavanger HF. Postboks 8100. 4068 Stavanger, Norway, mmborda@gmail.com
J Frailty Aging 2024;13(4)441-447
Published online April 25, 2024, http://dx.doi.org/10.14283/jfa.2024.39
Abstract
BACKGROUND: Sarcopenia contributes to increased hospitalizations, cognitive impairment, falls, and all-cause mortality. Current diagnostic methods, like body Magnetic Resonance Imaging and dual-energy X-ray absorptiometry, are costly and impractical. Notably, there is no standardized approach for assessing sarcopenia in dementia clinics. We studied the association of temporal muscle thickness (TMT) with key prognostic factors in people with Alzheimer’s disease (AD) and Lewy body dementia (DLB).
METHODS: We utilized data from the DemVest, a longitudinal cohort study, and included participants clinically diagnosed with mild AD or DLB. TMT was measured using baseline MRI scans. The main outcome measures were cognition, functional performance, malnutrition, and mortality. Various demographic and clinical factors were considered as potential confounders.
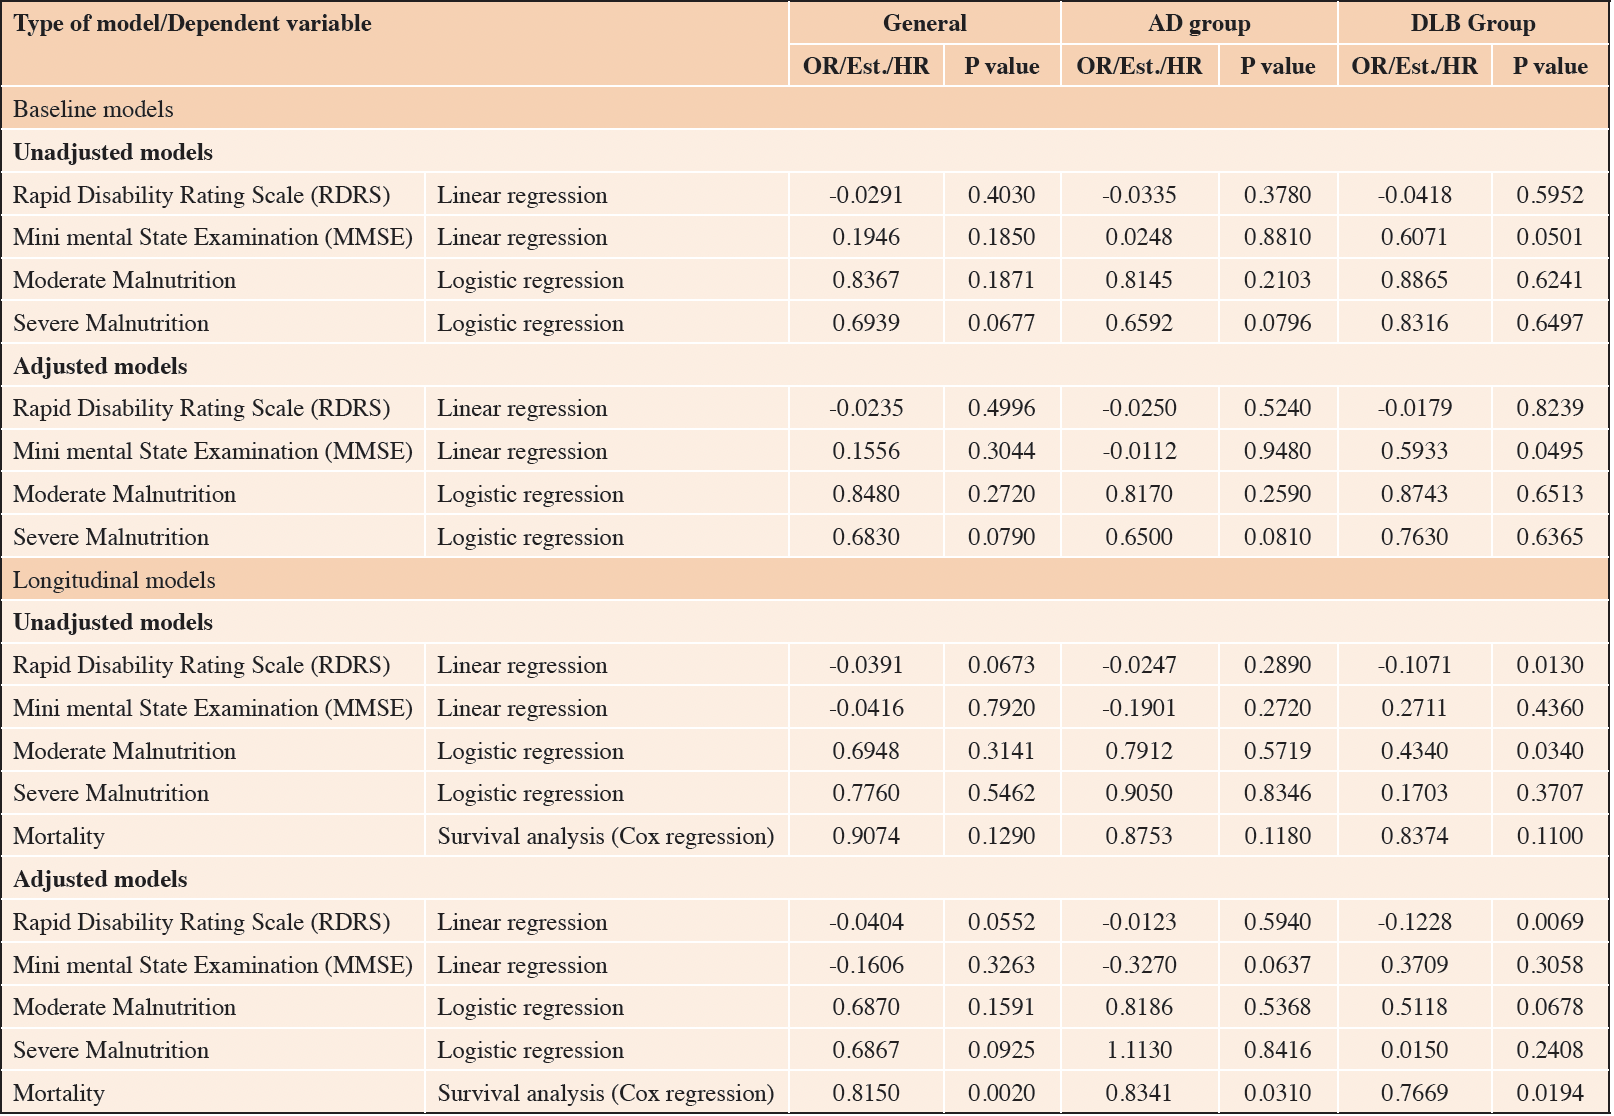
RESULTS: The AD sample was mainly composed by females(76.9%), age 75.5(SD 6.95). The DLB sample was mostly composed by men(63.6%), age 75.8(SD 6.85). At baseline TMT showed significant association with cognitive performance in the DLB group (Est.=0.593, p-value=0.049). The longitudinal analysis revealed significant associations between TMT and functional decline in DLB (Est.=-0.123, p-value 0.007) and increased mortality in the whole sample(HR=0.815, p-value 0.002), the AD group (HR=0.834 p-value=0.031), and the DLB group (HR=0.767 p-value=0.019) respectively. These associations remained significant after adjusting for confounders.
CONCLUSIONS: The TMT measurement was associated with mortality in both dementia groups as well as with cognition and function in DLB. TMT emerges as a cost-efficient measure of muscle mass indicating clinical relevance and utility in healthcare settings. Implementing TMT assessment could improve patient care and aid in identifying individuals at risk of adverse outcomes in mild dementia.
Key words: Sarcopenia, Dementia, Temporal muscle thickness (TMT), muscle, functionality, malnutrition.
Introduction
Sarcopenia is characterized by the age-related loss of muscle mass and function. It has been strongly linked to a poorer prognosis not only in healthy older adults but also in those with various medical conditions, such as cancer, trauma, respiratory disease, heart failure, and dementia (1). Implications associated with sarcopenia include increased postoperative complications, hospitalizations, falls, functional loss, and accelerated disease progression. Additionally, sarcopenia has been linked to dysphagia, cognitive impairment, and all-cause mortality (1, 2). Specifically, in older adults living with dementia, sarcopenia or its components (muscle mass and muscle function), have been correlated with reduced cognitive performance and smaller brain volumes (3, 4). This phenomenon can be explained by several systemic effects generated by muscle, including the production of myokines, anti-inflammatory substances, and the stimulation of BDNF synthesis (5).
Despite the clinical significance of sarcopenia, it is often underdiagnosed, and its importance and detection are frequently underestimated. This issue is compounded by the high costs and impracticality associated with gold-standard methods like body Magnetic Resonance Imaging (MRI) and dual-energy X-ray absorptiometry (DXA). In addition, previous studies have revealed limited availability of DXA or even more accessible options such as Bioelectrical Impedance Analysis (BIA) (2). This concern becomes more pronounced in scenarios where the timely detection of sarcopenia is crucial, but practical constraints, including time and resources, make it infeasible. This is particularly relevant in situations such as in patients with stroke, head trauma, or those being treated in memory clinics. And, importantly, in patients with dementia where assessments should be as quick and comfortable as possible to decrease discomfort associated with healthcare.
Sarcopenia and dementia are the primary causes of disability in older adults (6). Dementia places a significant burden on society, resulting in the loss of disability-adjusted life years, premature mortality, and substantial societal costs. Remarkably, the economic and social impact of dementia is on par with that of conditions like stroke, heart disease, and cancer (6).
Despite its significance, there is currently no standardized method for assessing sarcopenia in patients living with dementia. In this context, we propose a practical and cost-effective approach to estimate muscle mass. By leveraging existing brain imaging studies, it is possible to measure temporal muscle thickness (TMT) manually using CT or MRI scans. TMT has been studied as a surrogate marker for assessing the risk of sarcopenia in various patient groups (7–11), and in patients who have suffered a stroke, TMT predicted physical function three months after the stroke event (12). Patients with multiple sclerosis exhibit an accelerated thinning of the TMT, and this thinning has been correlated with disability in the later stages of the disease (13). TMT has been identified as an independent risk factor for overall survival in patients diagnosed with brain tumors, both primary and metastatic. Regression models have indicated a reduced risk of death by 19 to 24% with every additional millimeter of baseline TMT (14, 15). Similar findings have been observed regarding progression-free survival in individuals with head and neck squamous cell carcinoma (9).
These findings underscore the importance of TMT measurements as a valuable tool in assessing physical function, disability, and survival outcomes in a range of medical conditions. The consistent association between TMT and these outcomes highlights its potential as a practical and clinically relevant marker in various healthcare settings especially in the context of dementia and memory clinics. This is why our study aims to assess the cross-sectional and longitudinal association of TMT on function, cognition, malnutrition, and mortality in older adults diagnosed with mild dementia. We will separately evaluate Alzheimer’s Disease (AD) and Dementia with Lewy Bodies (DLB) due to their different presentations and DLB greater motor and systemic compromise.
Methods
Setting and participants
«The Dementia Study of Western Norway» (DemVest) is a longitudinal cohort study conducted in Norway, recruiting participants between 2005 and 2013, and conducting annual follow-up assessments. The study aimed to investigate dementia-related factors in the Hordaland and Rogaland counties, where all residents were covered by the same National Insurance Scheme. A comprehensive description of the methodology can be found elsewhere (16).
Participants were enrolled from referrals to dementia clinics, with exclusion criteria including moderate or severe dementia, delirium, past bipolar or psychotic conditions, terminal illness, or newly diagnosed substantial somatic diseases that could significantly affect cognition, function, or participation. For our present study, we focused on subjects clinically diagnosed with mild Alzheimer’s disease or Dementia with Lewy bodies, who had baseline MRI data available. From an initial sample of n=111 (AD=78, DLB=33), we selected individuals assessed using the same scanner and possessing good quality MRI images for brain and muscle measurements. This led to a final sample of 37 AD and 10 DLB participants.
Assessments
Dementia diagnosis
Dementia diagnoses were made based on DSM-IV criteria, and further classified into AD and DLB. Mild dementia was defined as a Mini-Mental Status Examination (MMSE) score of ≥ 20 or a Clinical Dementia Rating (CDR) global score of = 1. Detailed medical information and comorbidities were gathered from medical records, supplemented by structured assessments. Dopamine transporter SPECT scans were available for most patients suspected of having DLB.
Pathological diagnosis was made on 56 subjects of the DemVest cohort, with an accuracy above 80% when compared to the clinical criteria (17).
Assessment of Nutritional Status
In this study, the Global Leadership Initiative on Malnutrition (GLIM) Index served as the tool for evaluating nutritional status (18). Using a set of predefined criteria, two key factors, namely body mass index (BMI) and age, were employed to classify individuals into one of three distinct nutritional status categories: severe malnutrition, moderate malnutrition, or adequate nutritional status.
For severe malnutrition, individuals with a BMI less than 18.5 who were under 70 years old, as well as those with a BMI less than 20 who were 70 years or older, were identified as being severely malnourished. In the case of moderate malnutrition, individuals with a BMI less than 20 under the age of 70 and a BMI less than 22 for those 70 years or older were categorized as moderately malnourished. Participants who did not meet the criteria for either of these established categories were considered to have no signs of malnutrition.
The nutritional status of participants was assessed at the beginning of the study and annually over a period of 5 years of follow-up.
Imaging methods
MRI scans were acquired at baseline using a standardized protocol on a 1.5-T Philips Intera scanner at Stavanger University Hospital. The 3D T1-weighted images were obtained with parameters including a repetition time (TR) of 10.0 ms, echo time (TE) of 4.6 ms, flip angle of 30°, number of excitations (NEX) of 2, acquisition matrix of 256 x 256, and voxel size of 1.0156 x 1.0156 x 1 mm³. Images were subjected to quality checks, and those with movement artifacts or poor quality were discarded. A standardized pre-processing approach was applied, involving movement correction and intensity normalization. Scans with poor quality were excluded, and the retained images were used for assessing TMT. (See Supplementary Material: figure 1 )
For the measurement of the temporal muscle, on axial T1-weighted images, TMT was measured on the right and left sides separately in all patients, perpendicular to the long axis of the temporalis muscle, using the Sylvian fissure as a reference and the orbit roof. A mean TMT was calculated for each patient for further statistical analysis (Figure 1). Measurements were performed by one trained researcher, and we re-measured 20 random images to ensure good intra-rater reliability.
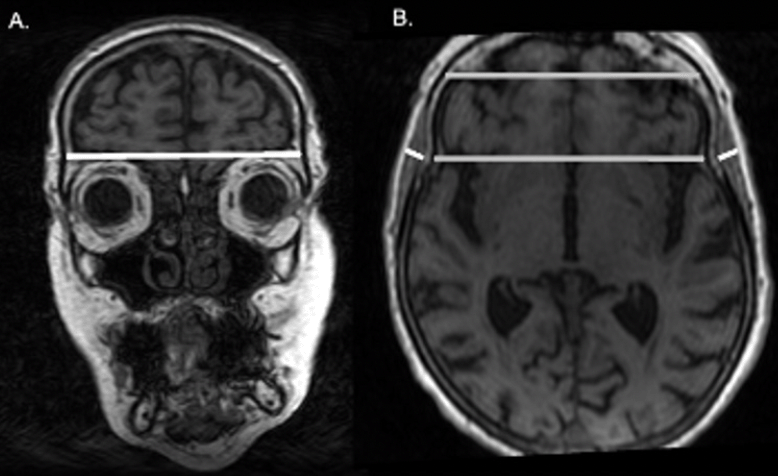
Figure 1. Measure of TMT in one of the participants. A representative case for the assessment of the TMT on MRI
a. Coronal view of the brain. The TMT was measured on the right and left sides separately in all patients, perpendicular to the long axis of the temporalis muscle. b. Axial view of the brain. The Sylvian fissure and orbit roof were used as points of reference for the measurement.
Other variables
As potential confounders, demographic factors were considered such as gender and age. BMI was calculated using body weight and height with the formula BMI = weight (kg)/height (m)2. Comorbidities using the Cumulative Illness Rating Scale (CIRS) based on patient and informant reports and global cognitive performance using the Norwegian version of the MMSE (19). Instrumental and basic activities of daily living were evaluated with the Norwegian version of the Rapid Disability Rating Scale-2 (RDRS-2) (20). RDRS-2 was performed in person by the research nurses at the various outpatient clinics. Items were scored from 1 to 4 (Alone=1, with some help=2, with a lot of help, =3 and cannot perform=4) and then divided by the number of items (0 minimum and 4 maximum total score). The more functional decline is present, the higher the score becomes.
Ethical Considerations
This study was approved by the regional ethics committee (approval code: 2010/633) and the Norwegian authorities for the collection of medical data. All data was handled and kept following national health and data privacy protocols. All participants signed an informed consent form before inclusion in the study.
Statistical Analysis
A descriptive analysis was conducted, involving the estimation of percentages for categorical variables and means with standard deviations for quantitative variables. Most analyses were performed in the combined dementia group as well as AD and DLB separately. This descriptive analysis was also done for each study time point, at baseline and then yearly to the five-year follow-up, including the number of individuals for each study time point to describe attrition due to dropout, for both AD and DBL groups. (See Supplementary Material figure 1)
We also performed a correlation analysis using Spearman’s rho coefficient between the TMT and continuous variables (MMSE and RDRS) to evaluate any linear associations between these variables at baseline. To provide a visual representation of how TMT at baseline relates to the outcomes over time, scatter plots were generated using the predicted values or probability of the outcome for dichotomous variables (moderate and severe malnutrition) and the predicted values for the continuous variables, all adjusted for group, sex, and age.
For assessing associations between TMT and the clinical outcome measures, we conducted both unadjusted and adjusted linear and logistic regression models (adjusting for group, sex, and age). Similarly, we employed longitudinal outcome status analysis using unadjusted and adjusted (by group, sex, age, and time) linear or logistic mixed-effects models with random slopes to test associations between TMT at baseline and the outcomes over time. Age, sex, group, and time were included as fixed terms, while time was considered a random effect. Results were reported in terms of beta coefficients or odds ratios (ORs) along with their respective p-values.
Finally, a survival analysis using a Cox regression model was performed, both unadjusted and adjusted (by group, sex, and age), we considered CIRS and BMI as potential confounders but discarded after variable selection procedure and to avoid collinearity. To assess whether TMT was associated with mortality, the time-to-response variable was calculated from the date of inclusion in the study to the date of death. Participants who were still alive or for which the outcome of death was unknown were treated as censored. Adjusted relative risk of death and TMT stratified by group and sex were plotted. HR and their respective p-values were reported. Notably, none of the models were adjusted for BMI due to collinearity issues with TMT. We established statistical significance at p < 0.05 to evaluate the influence of covariates in the models or the hypothesis tests. All analyses were conducted using R Studio version 4.2.1.
Results
The demographic and clinical characteristics of the two groups are shown in Supplementary table 1 & 2. Information regarding the CIRS scores, malnutrition assessment and changes in characteristics at each follow-up visit, can be found in Supplemental material table 1.
Baseline
No statistically significant associations were found Between TMT and MMSE in the AD group. However, MMSE was significantly associated to TMT in the DLB group (Est.=0.593, p-value=0.049) (Table 1).
Longitudinal
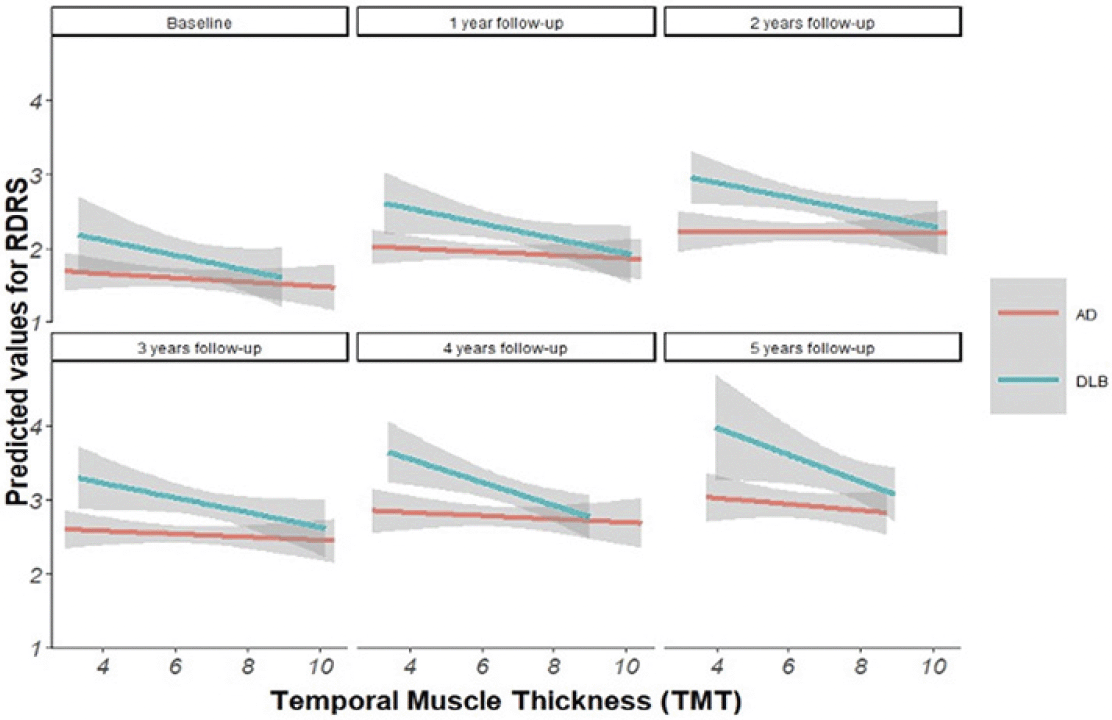
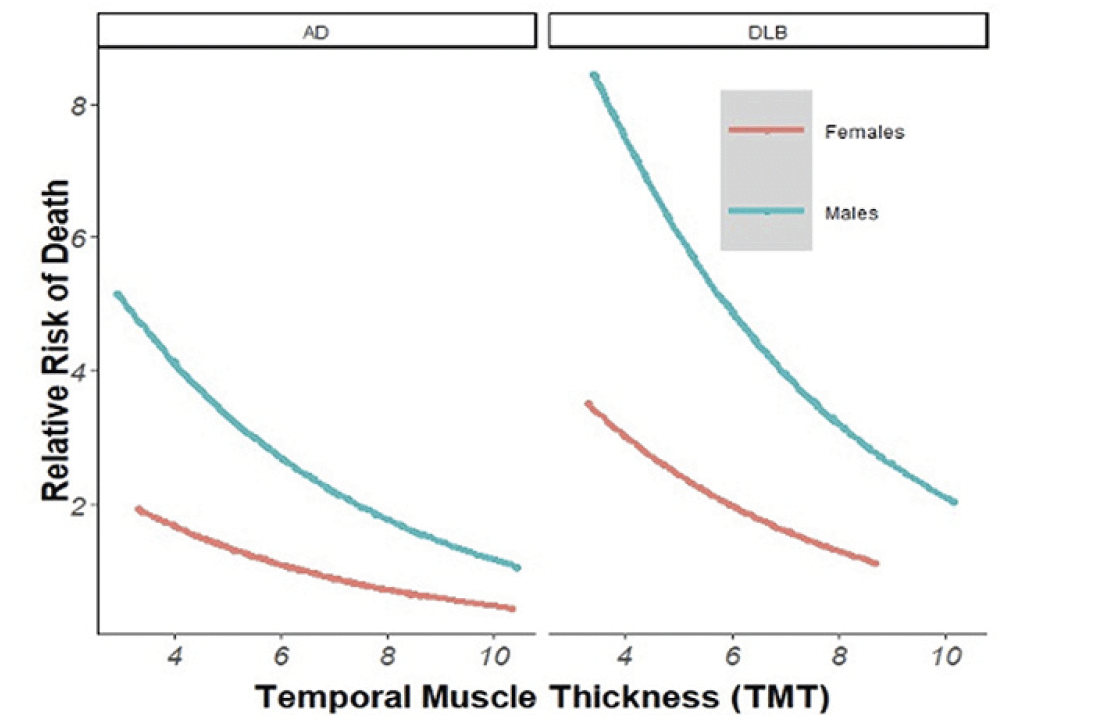
The Longitudinal model revealed significant associations between TMT and functional decline in DLB (Est.=-0.123, p-value 0.007) (Figure 2 & 3). In addition, statistically significant associations were found between TMT and mortality in the whole sample (HR=0.815, p-value 0.002), in the AD group (HR=0.834 p-value=0.031) and in the DLB group (HR=0.767 p-value=0.019), which also remained significant after adjusting for confounders. (Figure 4) (Table 1).
Note: Adjusted by group, sex; and age.
* Adjusted by group, sex, and age.
This figure shows the linear association between predicted values for RDRS and TMT for each group (AD and DBL) for each follow-up time point.
Note: Adjusted by group, sex, and age.
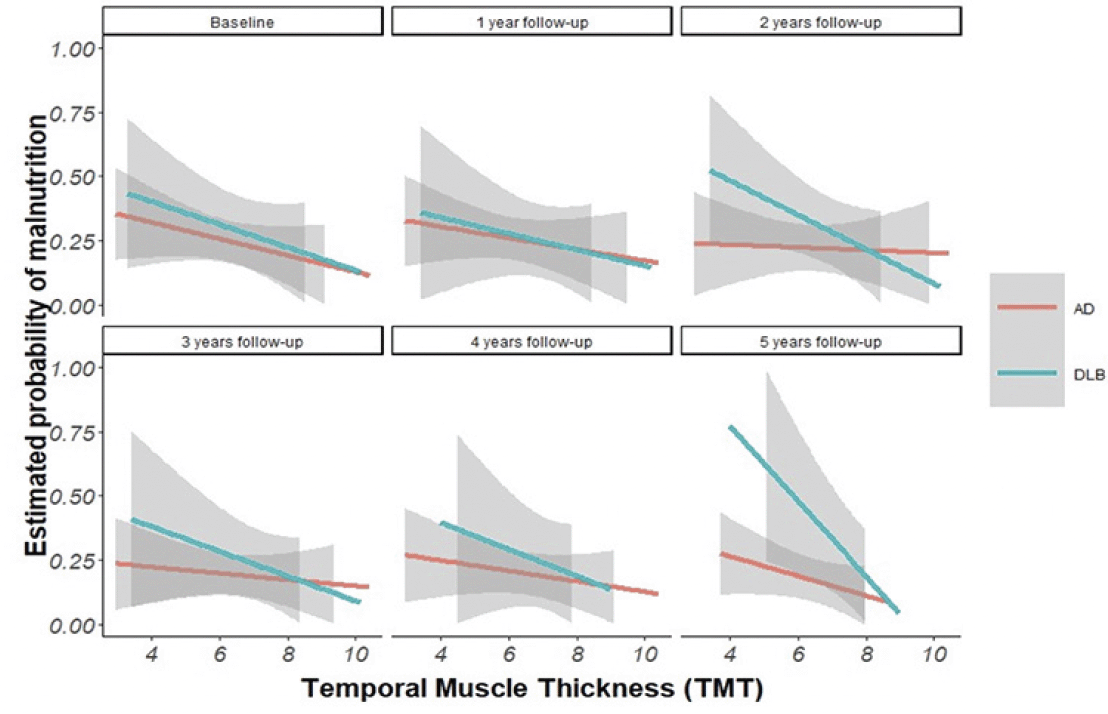
This figure shows the linear association between estimated probability of malnutrition and TMT for each group (AD and DBL) for each follow-up time point.
This figure shows the linear association between the relative risk of death and TMT for each group (AD and DBL) for each follow-up time point.
Discussion
The most noteworthy discovery in our study is the significant and consistent association between Temporal Muscle Thickness and the risk of mortality, both in individuals diagnosed with AD and DLB. These findings align with previous research in other populations. For example, Kara et al. investigated ultrasonographic temporal muscle thickness and identified TMT as a significant predictor of mortality in prevalent hemodialysis patients. They also reported a weak to mild correlation with BMI, albumin levels, and the malnutrition inflammation score, emphasizing the potential value of TMT as a prognostic marker (21).
Furthermore, TMT has demonstrated its independence as a predictor of survival prognosis in people diagnosed with primary glioblastoma, where it is linked not only to survival but also to the risk of early treatment discontinuation and a significantly reduced chance of receiving second-line treatment (22).
In our study, we also observed a significant association, especially in DLB patients, between TMT and functional decline. Specifically, smaller TMT measurements were associated with greater functional compromise, and this relationship became even more pronounced in our longitudinal adjusted analysis. Previous investigations in patients undergoing endovascular thrombectomy have revealed that larger TMT is an independent predictor of favorable functional independence, with this effect appearing to be more pronounced in adults aged 80 years and older compared to younger patients (23).
TMT also proved to be a valuable marker of moderate and severe malnutrition in DLB patients, consistent with findings in other populations. Notably, TMT has demonstrated its utility as an indicator of nutritional status and general muscle mass. In an older Japanese population, TMT showed robust correlations with various measures of muscle mass, including calf circumference and arm muscle circumference (24). In a recent study by our group, using data from Swedish community dwelling older adults we found a significant correlation between the TMT measured in head MRI and ALSTI measured with DXA, suggesting that muscle mass in the head region may be a useful indicator of overall muscle mass when other more complex tools are not available (25).
Moreover, our study identified a significant association between lower TMT and lower MMSE scores at baseline for DLB patients. Our baseline Spearman Rho analysis revealed a statistically significant association between the TMT and MMSE in the DLB group with a strong correlation (Rho 0.364). This finding is consistent with previous research by Cho et al., which revealed a correlation between TMT and MMSE scores in dementia patients. Importantly, this correlation remained statistically significant after adjusting for confounding variables (24).
There are certain limitations to our study that warrant acknowledgment. There may be a potential recruitment bias owing to referrals from primary care, potentially resulting in the inclusion of patients with less complex dementia or those who were relatively healthy. Nevertheless, general practitioners were encouraged to refer any patient with suspected dementia.
The DEMVEST study was not originally designed to address the specific objectives of this paper, which may introduce potential limitations when analyzing the data and controlling for interactions. Furthermore, the absence of a comparison with a healthy control group prevents us from assessing whether the participants under study differed from healthy older adults.
Additionally, we did not investigate conditions that might affect muscle volumes, such as missing teeth, bruxism, or hypertonia in DLB. The sample size was small due to imaging availability and quality selection, and longitudinal analyses were not performed because images were only available at baseline. While conducting this novel but exploratory study, the limited data available poses challenges in making accurate estimations. Nevertheless, existing research on population-based studies within healthy populations has demonstrated the TMT’s value as a prognostic marker (25).
However, this study boasts several strengths. Notably, to our knowledge this is the first to assess the prognostic qualities of TMT in patients with mild dementia. Additionally, our data is derived from the DemVest study, ensuring that all patients were covered by the same insurance scheme and that potential confounding factors, such as somatic diseases, delirium, and other mental health conditions, were rigorously excluded. This contrasts with studies relying on retrospective data collection. In our study, we refrained from employing specific cut-off points for TMT measurements. This choice was motivated by the fact that validated cut-off values from previous studies were established in distinct populations, some of which might have had different health profiles (e.g., stroke and glioblastoma patients). These previous studies typically endorsed TMT cut-off values of ≤ 6.3 mm for males and ≤ 5.2 mm for females. However, it’s worth noting that there remains substantial variation in the adopted cut-off points, as evidenced by a recent systematic review and meta-analysis (26).
Moreover, it’s important to recognize that these cut-off values were derived through a more precise yet intricate method, involving specific anatomical reference areas for muscle measurement. This approach may pose challenges for non-radiologists in clinical settings, potentially limiting its widespread use (8, 15). Different TMT measurement methods have demonstrated their worth in predicting progression-free survival in head and neck squamous cell carcinoma (9). Additionally, TMT serves as a valuable prognostic indicator and surrogate marker for assessing skeletal muscle mass and nutritional status in stroke and glioblastoma cases (26, 27).However, it should be noted that the applicability of this technique may vary across different contexts, necessitating further research and implementation considerations.
Healthcare providers should contemplate employing a TMT or any available resource to evaluate muscle mass, particularly when readily available imaging resources can be utilized opportunistically for this objective. These approaches could facilitate more timely assessments and interventions for addressing muscle mass depletion.
Our study underscores the significant connections between TMT and mortality in patients with dementia. Given that most dementia patients undergo head CT or brain MRI as part of their routine evaluation, we propose considering TMT assessment for assessing the risk of adverse outcomes, ultimately leading to improved patient care and better-informed clinical decisions.
Funding: This paper represents independent research supported by the Norwegian government, through hospital owner Helse Vest (Western Norway Regional Health Authority). Also, funded by the National Institute for Health Research (NIHR) Biomedical Research Centre at South London and Maudsley NHS Foundation Trust and King’s College London. This work was supported by NordForsk through the funding to Nordic-Japan multidomain interventions for healthy aging and prevention of dementia and disability, project number 119886. Open access funding provided by University of Stavanger & Stavanger University Hospital.
Acknowledgments: We want to thank the participants, researchers, and technical staff that made the DemVest study possible, as well as staff and facilities provided by (SESAM) Centre for age-related medicine at Stavanger, Norway. In addition to Santiago Salazar for his contribution in the imaging processing procedures.
Competing interests statement: The authors have no conflicts of interest to declare. The funders had no role in the design of the study, in the collection, analyses, or interpretation of data, in the writing of the manuscript, or in the decision to publish the results. The views expressed are those of the author(s) and not necessarily those of the NHS, the NIHR, or the Department of Health and Social Care.
Author contributions: All authors have contributed sufficiently to the manuscript conceptualization, data curation, analysis, drafting, revision, and final approval to be included as authors.
Open Access: This article is distributed under the terms of the Creative Commons Attribution 4.0 International License (http://creativecommons.org/licenses/by/4.0/), which permits use, duplication, adaptation, distribution and reproduction in any medium or format, as long as you give appropriate credit to the original author(s) and the source, provide a link to the Creative Commons license and indicate if changes were made.
References
1. Xia L, Zhao R, Wan Q, et al. Sarcopenia and adverse health-related outcomes: An umbrella review of meta-analyses of observational studies. Cancer Med 2020;9:7964–7978
2. Treviño-Aguirre E, López-Teros T, Gutiérrez-Robledo L, Vandewoude M, Pérez-Zepeda M. Availability and use of dual energy X-ray absorptiometry (DXA) and bio-impedance analysis (BIA) for the evaluation of sarcopenia by Belgian and Latin American geriatricians. J Cachexia Sarcopenia Muscle 2014;5:79–81
3. Chang K-V, Hsu T-H, Wu W-T, Huang K-C, Han D-S. Association Between Sarcopenia and Cognitive Impairment: A Systematic Review and Meta-Analysis. J Am Med Dir Assoc ;17:1164.e7-1164.e15
4. Beeri MS, Leugrans SE, Delbono O, Bennett DA, Buchman AS. Sarcopenia is associated with incident Alzheimer’s dementia, mild cognitive impairment, and cognitive decline. J Am Geriatr Soc 2021;69:1826–1835
5. Pedersen BK. Physical activity and muscle-brain crosstalk. Nat Rev Endocrinol 2019;15:383–392
6. Nichols E, Steinmetz JD, Vollset SE, et al. Estimation of the global prevalence of dementia in 2019 and forecasted prevalence in 2050: an analysis for the Global Burden of Disease Study 2019. Lancet Public Health 2022;7:e105–e125
7. Nozoe M, Kubo H, Kanai M, et al. Reliability and validity of measuring temporal muscle thickness as the evaluation of sarcopenia risk and the relationship with functional outcome in older patients with acute stroke. Clin Neurol Neurosurg 2021;201:106444
8. Steindl A, Leitner J, Schwarz M, et al. Sarcopenia in Neurological Patients: Standard Values for Temporal Muscle Thickness and Muscle Strength Evaluation. J Clin Med 2020;9:1272
9. Lee B, Bae YJ, Jeong W-J, Kim H, Choi BS, Kim JH. Temporalis muscle thickness as an indicator of sarcopenia predicts progression-free survival in head and neck squamous cell carcinoma. Sci Rep 2021;11:19717
10. Peball M, Valent D, Grossauer A, et al. Temporal Muscle Thickness Correlates with Sarcopenia in Parkinson’s Disease. J Park Dis 2023;13:341–350
11. Furtner J, Weller M, Weber M, et al. Temporal Muscle Thickness as a Prognostic Marker in Patients with Newly Diagnosed Glioblastoma: Translational Imaging Analysis of the CENTRIC EORTC 26071–22072 and CORE Trials. Clin Cancer Res 2022;28:129–136
12. Nagano A, Shimizu A, Maeda K, et al. Predictive Value of Temporal Muscle Thickness for Sarcopenia after Acute Stroke in Older Patients. Nutrients 2022;14:5048
13. Haider L, Chung KK, Mangesius S, et al. The relation of sarcopenia and disability in multiple sclerosis. Mult Scler Relat Disord 2023;77:104855
14. Yang Y-W, Ming Yang, Zhou Y-W, et al. Prognostic value of temporal muscle thickness, a novel radiographic marker of sarcopenia, in patients with brain tumor: A systematic review and meta-analysis. Nutrition 2023;112:112077
15. Furtner J, Berghoff AS, Albtoush OM, et al. Survival prediction using temporal muscle thickness measurements on cranial magnetic resonance images in patients with newly diagnosed brain metastases. Eur Radiol 2017;27:3167–3173
16. Vik-Mo AO, Giil LM, Borda MG, Ballard C, Aarsland D. The individual course of neuropsychiatric symptoms in people with Alzheimer’s and Lewy body dementia: 12-year longitudinal cohort study. Br J Psychiatry J Ment Sci 2020;216:43–48
17. Skogseth R, Hortobágyi T, Soennesyn H, et al. Accuracy of Clinical Diagnosis of Dementia with Lewy Bodies versus Neuropathology. J Alzheimers Dis JAD 2017;59:1139–1152
18. Global Leadership Initiative on Malnutrition (GLIM) Framework – EFAD.
19. Bredal IS. The Norwegian version of the Mini-Mental Adjustment to Cancer Scale: factor structure and psychometric properties. Psychooncology 2010;19:216–221
20. Linn MW. Rapid Disability Rating Scale-2 (RDRS-2). Psychopharmacol Bull 1988;24:799–780
21. Kara E, Şahutoğlu T, Demirbaş S, Beyazal M. Temporal muscle thickness predicts mortality in prevalent hemodialysis patients. Rev Assoc Medica Bras 1992 2022;68:1715–1720
22. Broen MPG, Beckers R, Willemsen ACH, et al. Temporal muscle thickness as an independent prognostic imaging marker in newly diagnosed glioblastoma patients: A validation study. Neuro-Oncol Adv 2022;4:vdac038
23. Lin Y-H, Chung C-T, Chen C-H, et al. Association of temporalis muscle thickness with functional outcomes in patients undergoing endovascular thrombectomy. Eur J Radiol 2023;163:110808
24. Cho J, Park M, Moon W-J, Han S-H, Moon Y. Sarcopenia in patients with dementia: correlation of temporalis muscle thickness with appendicular muscle mass. Neurol Sci Off J Ital Neurol Soc Ital Soc Clin Neurophysiol 2022;43:3089–3095
25. Borda MG, Baldera JP, Samuelsson J, et al. Temporal Muscle Thickness: A Practical Approximation for Assessing Muscle Mass in older adults[Manuscript submitted for publication]. 2023
26. Sadhwani N, Aggarwal A, Mishra A, Garg K. Temporal muscle thickness as an independent prognostic marker in glioblastoma patients—a systematic review and meta-analysis. Neurosurg Rev 2022;45:3619–3628
27. Katsuki M, Kakizawa Y, Nishikawa A, et al. Temporal Muscle and Stroke—A Narrative Review on Current Meaning and Clinical Applications of Temporal Muscle Thickness, Area, and Volume. Nutrients 2022;14:687
The Author(s) 2024

